Crash! And now what?
Imagine you've just deployed an embedded device in the world and of course, you have tested it thoroughly and it works. To monitor the device, you've set up some logging.
You're happy with the result until you see the following logs:
[15:28:23.654 2022-03-08] Info: Work it harder, make it better
[16:05:34.197 2022-03-08] Info: Do it faster makes us stronger
[16:12:56.054 2022-03-08] Info: More than ever, hour after hour
[16:19:40.846 2022-03-08] Info: Work is never over
[16:19:40.847 2022-03-08] Error: Panic 'Index out of bounds', some/rust/core/file.rs:233:5
Now you're not happy anymore. At least the device didn't die, and it was able to log the panic. However, it does not help us that much. We know the direct reason it crashed, but we don't know what the device was doing at that point. Index out of bounds? Which index and what are the bounds? The place where the exact panic occurred is used everywhere throughout our application, so that doesn't help us much either.
Wouldn't it be nice if we could do something to get more context next time?
Luckily, we can! All the information we need is right there on the device at the time of the crash. What if we could capture it?
I've been working on creating some tools that do just that and I've called them:
Stackdump
You can find Stackdump on GitHub here. It's split up into these crates:
High-level overview
To go back to the example, what can we do?
In debuggers, we can see really nice stack traces and all variables in scope. Debuggers can do this because they have access to the program memory, registers and the debug info of the executable. The debug info tells the debugger everything it needs to know about the program.
When our device crashes, all of the memory and state are still there. Because, when using Rust, a crash is either a panic or one of the platform-specific exceptions. In both cases, the memory of the device is still intact.
We don't have any debug info on the device, though. That debug info can be found in the executable that the compiler built, but it's never flashed to the device because that would waste too much space.
So what if, instead of having the device figure out where it went wrong, we simply send our device state to a server with access to the original executable? That's precisely what the Stackdump tools help you do.
In short, these are the steps that need to be done:
Note: the steps with the * are the ones where the stackdump tools will help you
- Decide to make a stackdump
- Capture the registers (* in
capture) - Capture (some of) the stack memory (* in
capture) - Capture any other data you think you need (* in
capture) - Store the data somewhere on the device until it is ready to send it
- Send the captured data to the server (serialization & deserialization = * in
core) - Correlate the data with the correct executable and debug info
- Read and parse the debug info (* in
trace) - Create the stack trace by unwinding the stack (* in
trace) - For each frame, try to find the variables and read their values from the captured data (* in
trace) - Print out everything in a human-readable format (* in
trace)
Basically, Stackdump does all of the difficult things for you. All you need to do is manage the data.
The crates have been built so that you can integrate everything into your own stack. But there's also a CLI application that can do some things for you. For example, if you have a serialized dump as a file, you can use the CLI to read it and the executable, creating a nice stack trace for you.
Or when a device is in an unknown state, you can use the CLI to connect to the debug probe and capture all the data live.
How do you capture the memory and create a stack trace?
Capturing the booty
First, we can capture the stack and the registers when we detect a panic. The registers need to be captured because they contain the most immediate state of the program, like the program counter, link register, and stack pointer. We also need to capture the general-purpose registers because the value of a variable can be stored there as well. To know not only where we are but also where we've been, we need to capture the stack memory as well.
Each time a new function is entered, it puts its data on the stack on top of the previous data.
With Stackdump, we can capture the registers and the stack easily.
use core::mem::MaybeUninit;
use stackdump_core::memory_region::ArrayMemoryRegion;
use stackdump_core::register_data::ArrayRegisterData;

// We place the variables that hold the capture data in a static that is `.uninit`.
// This means that this data does not get initialized. This saves the MCU from having
// to carry data in flash or having to zero it out.
#[link_section = ".uninit"]
static mut STACK_CAPTURE: MaybeUninit<ArrayMemoryRegion<4096>> = MaybeUninit::uninit();
#[link_section = ".uninit"]
static mut CORE_REGISTERS_CAPTURE: MaybeUninit<ArrayRegisterData<16, u32>> = MaybeUninit::uninit();
#[link_section = ".uninit"]
static mut FPU_REGISTERS_CAPTURE: MaybeUninit<ArrayRegisterData<32, u32>> = MaybeUninit::uninit();

cortex_m::interrupt::free(|cs| {
    // This is safe to do because the *_CAPTURE values are only written to
    unsafe {
        stackdump_capture::cortex_m::capture(
            &mut *STACK_CAPTURE.as_mut_ptr(),
            &mut *CORE_REGISTERS_CAPTURE.as_mut_ptr(),
            &mut *FPU_REGISTERS_CAPTURE.as_mut_ptr(),
            &cs
        );
    }
});
Getting the data to the server
The device's memory has been captured, but it's still on the device somewhere and we need to get it out somehow.
How your device will contact a server is up to you because there are so many options. What is provided by Stackdump is a standard byte format for the dumps. You can get a byte iterator that has a little bit of framing so that even when they are clumped in the same byte stream, they can still be deciphered.
Of course, you don't have to send the dumps to a server if you have a way of storing the data as a file on your PC. You can do this with RTT and certain tools.
// This is safe to do if we know that we've already made a dump
// and (thus) these variables have been initialized
unsafe {
    let stack = &mut *STACKDUMP.as_mut_ptr();
    let core_registers = &mut *CORE_REGISTERS.as_mut_ptr();
    let fpu_registers = &mut *FPU_REGISTERS.as_mut_ptr();

    for byte in core_registers.bytes() {
        send_dump_byte(byte);
    }
    for byte in fpu_registers.bytes() {
        send_dump_byte(byte);
    }
    for byte in stack.bytes() {
        send_dump_byte(byte);
    }
}
The register and memory regions can also be serialized by Serde, but that may use too much memory on your device, hence the more annoying byte iterators.
Generating the trace
I'll assume that you have some sort of slice of data now on your server that contains the captured data. We now also need the data of the elf file that the compiler generated.
The tracing component has a struct called DeviceMemory in which we can register all of the memories we've captured. Let's do that first:
// Create the device memory
let mut device_memory = DeviceMemory::new();

// Get your dump data from somewhere
let dump_data: &[u8] = // ...

// This data can contain multiple dumps, so we need to peek ahead for the identifiers
let mut dump_iter = dump_data.into_iter().peekable();

while let Some(id) = dump_iter.peek().cloned() {
    match id {
        MEMORY_REGION_IDENTIFIER => {
            device_memory.add_memory_region(VecMemoryRegion::from_iter(&mut dump_iter))
        }
        REGISTER_DATA_IDENTIFIER => {
            device_memory.add_register_data(VecRegisterData::from_iter(&mut dump_iter))
        }
        _ => return Err("Dump data error. Got to an unexpected identifier".into()),
    }
}
Now, if we have the elf data, we can already generate the trace that we can then print out to our liking:
let elf_data = // ...
let frames = stackdump_trace::platform::trace::<CortexMPlatform>(device_memory, &elf_data)?;

for frame in frames {
    println!("{}", frame.display(true, false, false, Theme::None));
}
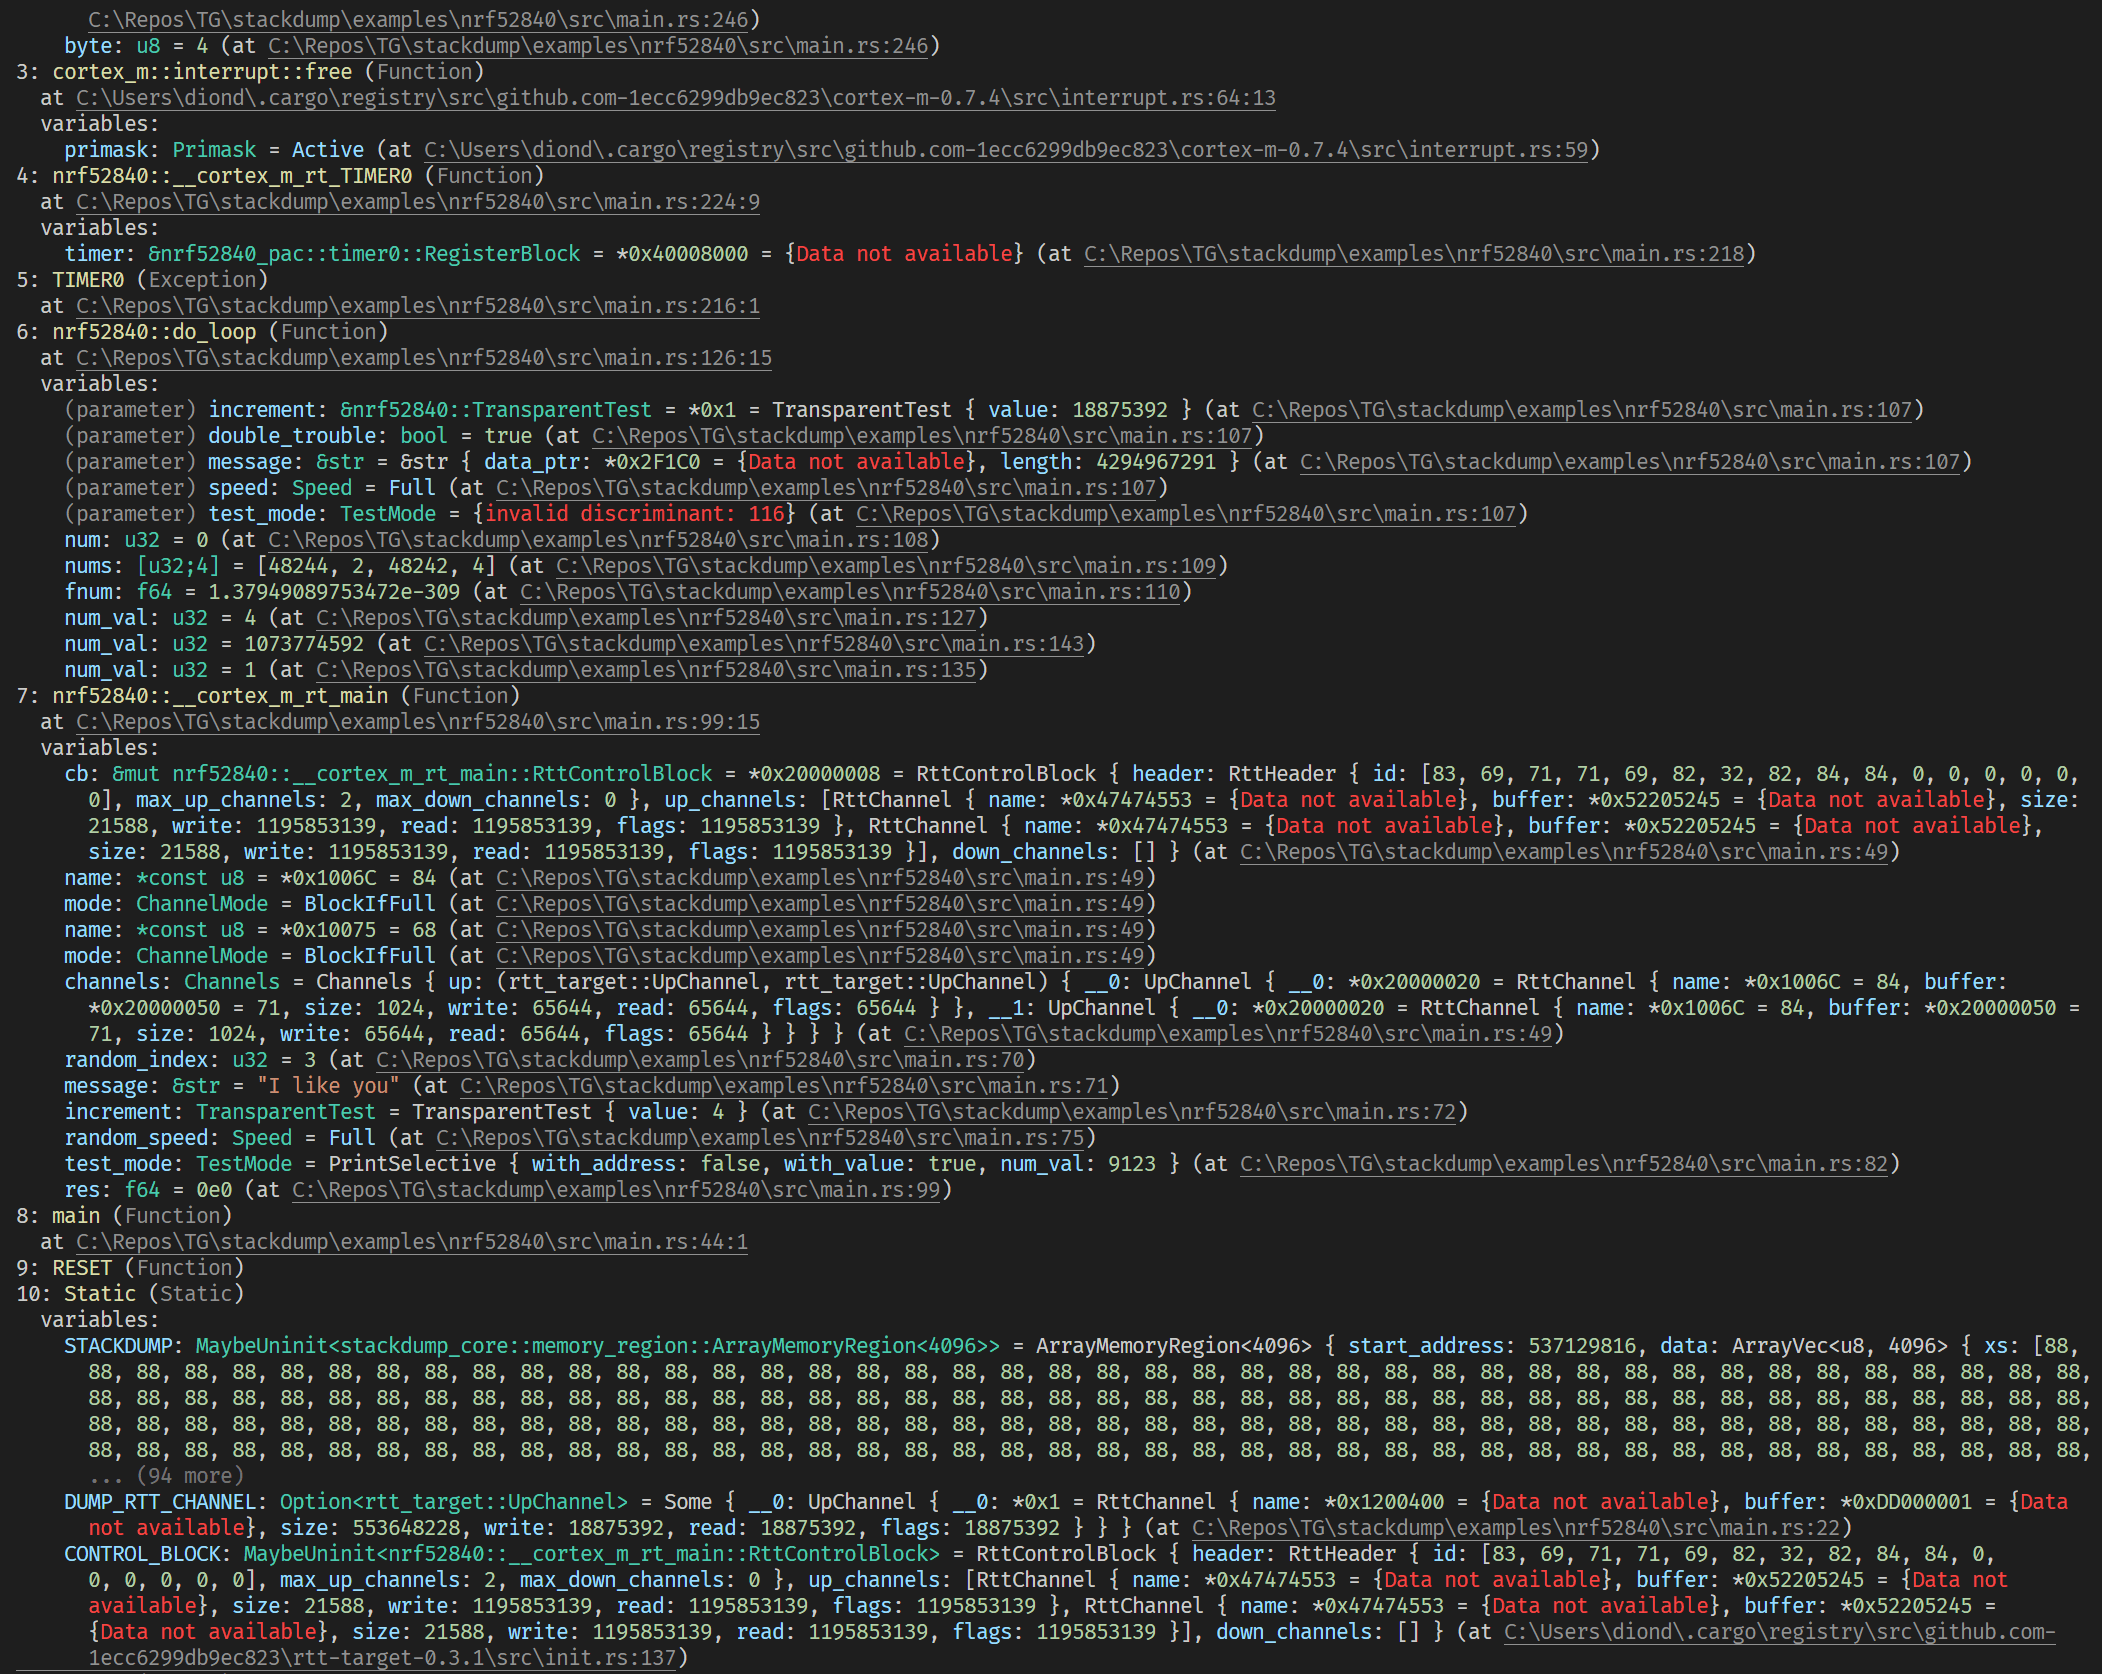
The CLI is a tiny bit fancier with what gets printed:
How did Stackdump come to be?
At my previous employer, I was getting a project ready for production. One of the things I was worried about was that if a device crashed, I wouldn't be able to fix it because I wouldn't know why it had crashed.
The probe-run tool was relatively new back then, and it had a backtrace. I thought it would be awesome to have it in my project as well. So I started to look at their source code.
Eventually I was able to capture my device's memory, send it to the server and run my trace. It was pretty cool I got this to work, and I learned a lot along the way. But the code was pretty messy and only the functions were backtraced, not any of the variables.
I was planning on making it open source, but due to circumstances, I wasn't able to do that.
During this time, I did look at reading out the variables using the die_offset, but I couldn't figure out how it'd all fit together.
A second try
A while later, I found myself working for Tweede golf and had some spare time, so I decided to rebuild the project, now open-source, from the start. It went well this time, and I was able to recreate the functionality quickly. Now, I wanted to put more effort in, and add reading the variables. Eventually, I started learning more about what the die_offset meant and how the DWARF debug format works. It looks insane at first glance, but it is quite sensible.
A lot of time went into creating the code for interpreting the DWARF info, building up my own structures, reading the data, and printing out something coherent. If there's interest, I could write an explainer about the DWARF format. It's pretty interesting!
The end result is Stackdump as it is today. I hope you give it a try and let me know what you think.