Introducing ntpd-rs metrics
Oftentimes, if the cable plugs in and the light turns green, we assume everything is working as expected. If a program doesn't immediately shut down after startup it probably works as expected. While it's usually true, do you really know what is going on? What does that green light even mean? This is why we say 'meten is weten'; only if you measure stuff, will you actually know what is going on.
We decided to apply this way of thinking to ntpd-rs, our modern implementation of the Network Time Protocol.
Why we need to measure NTP?
Especially in services like ntpd-rs, things might appear to be going OK with a quick look, even if they are not. The Network Time Protocol, NTP, only uses a very limited number of packets to determine what time your computer should have, and it attempts to adjust the clock in such a way that you shouldn't really notice any adjustments being made. Your computer probably has its clock set to a time that is roughly where it should be. The daemon running as a server is efficient enough that you probably don't notice the difference between no load and some load. NTP packets are small enough that you probably won't notice when many of them are being transferred over your network. And do you even know if your sources are giving you the right time?
If we don't measure any of these things our clock might start running the wrong time after a while. Or even worse, our server might not spread the time or it might even spread the wrong time to any number of clients.
Our integrated approach / comparison to others
Because we think that measuring your system is this important, we wanted to offer an integrated approach in our ntpd-rs daemon, all the while maintaining our security-conscious design. As such we opted to have our ntp daemon optionally expose a read-only socket for reading metrics. We include two clients that can connect to this socket. First there is ntp-ctl, a command line utility that gives you a glance at the current status of the daemon. Second, we also offer ntp-metrics-exporter, a Prometheus-based metrics daemon that exposes the available metrics over HTTP in the Prometheus format, such that they can be retrieved by a centralized metrics gathering service.
In other NTP daemons, we often do not find this integrated approach. Chrony offers a cmdport and the chronyc command line interface for talking with this port, in a very similar fashion as we found with ntpd-rs. However, we need an external Prometheus exporter for chrony when we want to send these metrics onward to the wider metrics gathering system.
The reference ntpd implementation meanwhile uses either NTP mode 6 packets or exports statistics to the filesystem. Mode 6 NTP packets are used by ntpd to send information about its operation over the NTP protocol. But letting anyone send such packets to the NTP server is unwelcome. They could be used to extract information from the server or to slow down the server since mode 6 packets often require extra processing compared to normal NTP packets. Using the filesystem for statistics also limits the frequency by which the metrics can be exported and requires additional disk access, which we would also prefer not to do in ntpd-rs.
What does ntpd-rs offer?
Currently, ntpd-rs has metrics for the system/clock state, the sources it receives time from, and the server functionality. We'll go over some of them to see what is available. For a full list, you should check our Prometheus output, or you can even use Prometheus or Grafana to explore all our metrics once you've set them up.
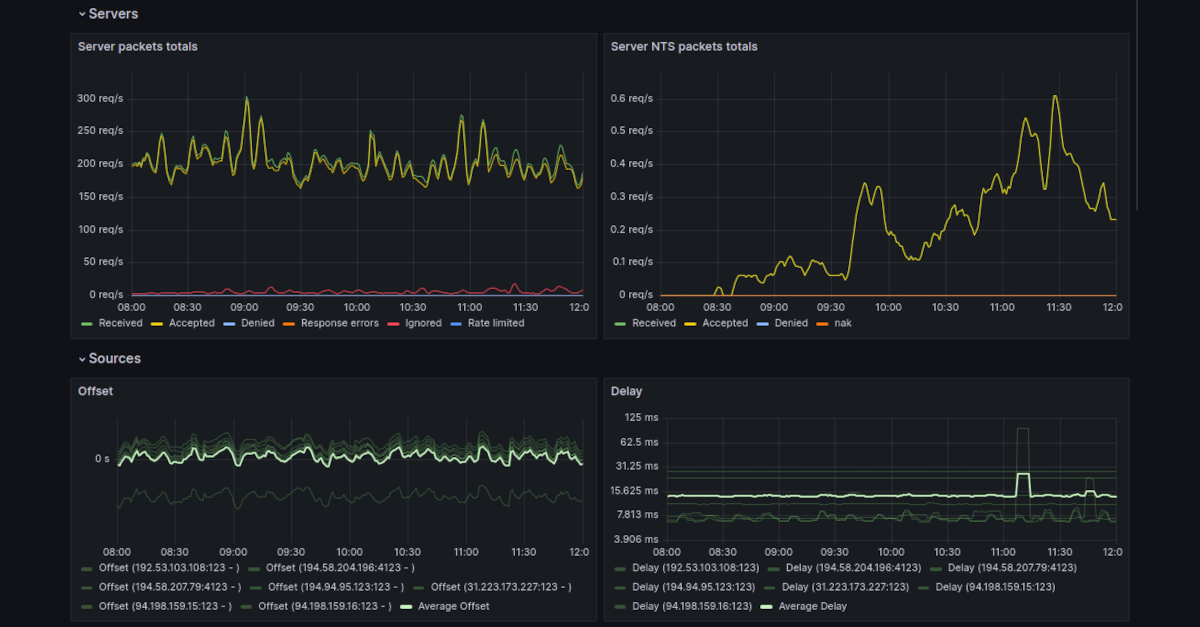
Server packets
In this graph we used a combination of the ntp_server_received_packets_total, ntp_server_accepted_packets_total, and several of the metrics indicating errors for server responses to see what kind of traffic our server received and how the server responded to them. We could use that information to determine when we need to increase server capacity. We could also use it to identify when we receive too much unwanted or faulty traffic and might need to block some clients.
Source reliability
Here we used the ntp_source_unanswered_polls metric to identify sources that could potentially be unreliable. As you can see, one of our sources seemed to be having some issues responding to our requests consistently. We could use that information to replace the source or notify them that they might have a reliability issue.
Poll intervals
As a final example, here we can see the intervals by which the system and sources are updated using the ntp_source_poll_interval_seconds and ntp_system_poll_interval_seconds metrics. We could use this information to identify reliability issues when the poll interval drops. We can also identify the interval with which the system should update the clock.
Adapt it for your workflow
Which metrics are relevant for your use case and how you use them very much depend on your workflow and the way you use ntpd-rs. For example, a server might be interested in the proportion of requests that were ignored or denied. Meanwhile, a client-only setup might be much more interested in the quality of their sources at this current moment in time, whereas others might be much more interested in the historical data for this. You might even want to combine and correlate things such as system load and network traffic to see how they affect your timekeeping. What you want to measure is up to you.
Don't limit yourself to just the data from the ntpd-rs daemon; you could also combine data from the node exporter. For example, you could take a look at network traffic combined with ntpd-rs server traffic. Or you could take a look at how the CPU utilization is correlated with ntpd-rs server traffic. Make sure to also check for one of the many other exporters available for Prometheus to get a more detailed picture of your networks and services.
To set up metrics for your installation, you simply need to start the metrics exporter daemon and make sure it's connected to your Prometheus instance. From there you can connect your Prometheus metrics to Grafana or any other monitoring system and start exploring.
We might still be missing some metrics for your specific use case that we currently don't expose, so we would love to hear what you need to monitor your time service!
Example usage of ntpd-rs metrics
We've set up an example dashboard full of ntpd-rs metrics for you to explore. This dashboard contains just a few examples of how to use these metrics. In fact, the embedded graphs you have been seeing previously come directly from that dashboard. We'd like to invite you to play around with this dashboard and see how these metrics could be used and how we can quickly identify issues with our ntpd-rs daemon this way, and we hope you find some inspiration for your own use cases through it.
Care to sponsor our work on time synchronisation?
The Pendulum project is building modern, full-featured implementations of the Network Time Protocol and the Precision Time Protocol. Pendulum focuses on security and robustness and uses the Rust programming language to guarantee memory safety.