Open Data geeft het antwoord: hoe groen is mijn wijk?
Met dat in mijn achterhoofd vroeg ik me af: wat is eigenlijk de meest groene buurt van Nijmegen?
Vegetatie en infrarood
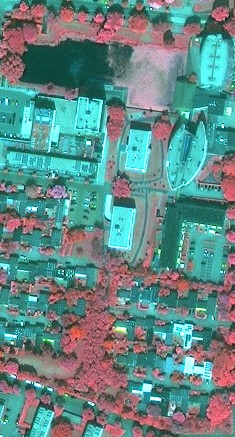
Het antwoord blijkt af te leiden uit Open Data beschikbare satellietfoto’s. De groen-grijs verhouding berekenen kan met een normale satellietfoto, maar nog beter gaat het als je gebruik kan maken van infrarood [1]. Een gezonde plant, met veel bladgroen, reflecteert veel infrarood - terwijl gebouwen en straten juist infrarood absorberen. Op die manier is het verschil tussen groen en grijs nog duidelijker te zien dan op een gewone foto. Gelukkig slaan veel satellieten [2] in de foto’s niet alleen de zichtbare (rood, groen, blauwe) kleuren op, maar ook informatie over infrarood.
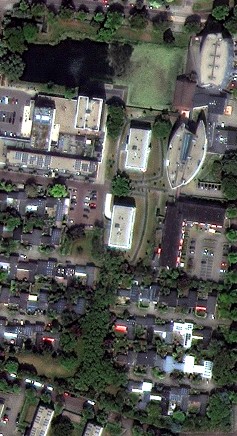 |  | |
| Normaal beeld | Infrarood beeld |
In foto’s op basis van infrarood zijn alle planten rood, hoe gezonder, hoe roder ze zijn. Alle bebouwing, pleinen en straten blijven groen zoals op bovenstaande afbeelding goed te zien is (inclusief de algen die op de vijver groeien).
Om makkelijker een verhouding te berekenen, zet ik vervolgens deze foto om in een zwart-wit foto op basis van de kleuren rood en groen. De verhouding tussen groen en "grijs" (niet-groen) van het gebied is dan simpel te berekenen, door de verhouding te nemen van de zwarte en de witte punten.
 | 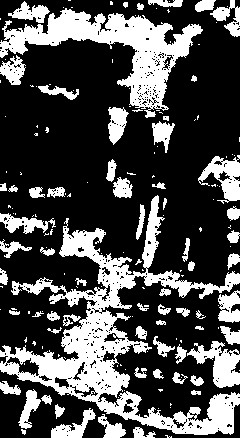 | |
| Infrarood | Zwart-wit |
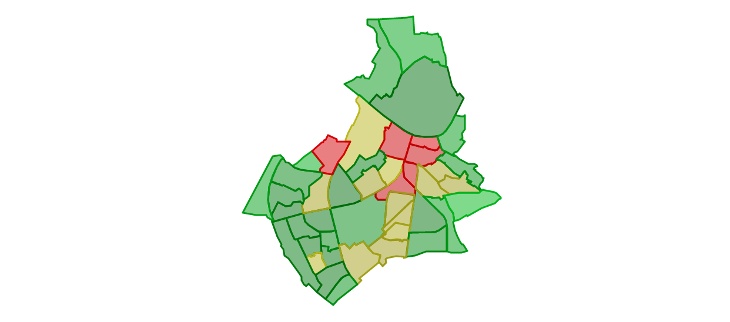
De groenste buurt
Op deze manier ben ik stap voor stap de groen/grijs-verhouding gaan berekenen van alle wijken in Nijmegen. Hieronder bijvoorbeeld de afbeelding van de Nijmeegse buurt Meijhorst, waar ik zelf woon: 32% groen.
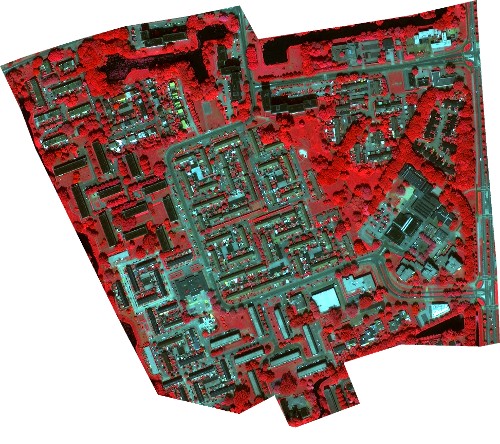 |
| Infrarood satellietfoto van Meijhorst |
Als ik de scores van de buurten op een kaart teken, heb ik eindelijk het antwoord waar ik naar zocht: de meest groene wijk in Nijmegen is Kwakkenberg.
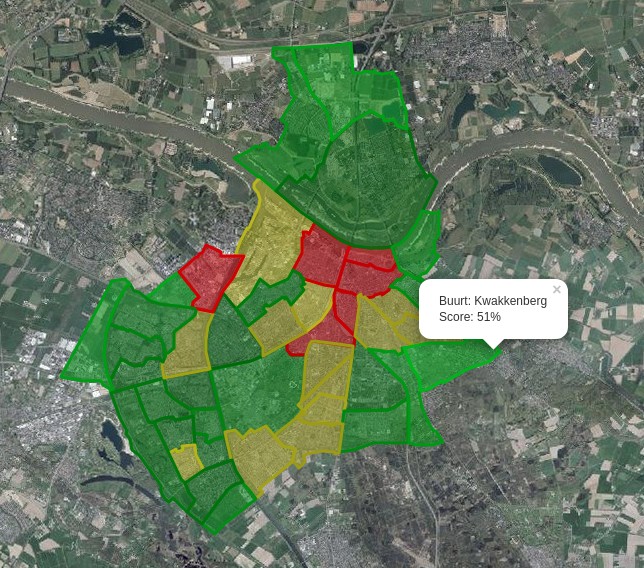 |
| De buurten van Nijmegen, op basis van de groen/grijs verhouding |
Zo heb ik het antwoord op mijn vraag gevonden, met behulp van als Open Data aangeboden satellietfoto’s met infrarood. De methode is simpel en effectief. Mijn onderzoek roept een vervolgvraag op: wat is de meest groene stad van Nederland? Misschien dat ik daar binnenkort in een vervolg op dit blog op terug kom.
Bram is developer bij Tweede golf en heeft veel interesse in data engineering, in het bijzonder (open) data waarmee vegetatie in kaart kan worden gebracht. Heb je vraagstukken waarbij "groene data" nodig is? Neem gerust contact op met Bram of Erik.